Traffic & Network History
LocalTelemetry includes a built-in network tracking engine that logs daily internet data usage, monitors real-time network throughput, and provides multi-year bandwidth history through deep integration with Windows system diagnostics.
Core Capabilities
- Real-Time Speed Tracking: Continuous live measurement of incoming (download) and outgoing (upload) network throughput.
- Daily Bandwidth Aggregation: Records total Megabytes (MB), Gigabytes (GB), and Terabytes (TB) uploaded and downloaded each day.
- Interactive Calendar Heatmap: Displays daily bandwidth usage color-coded across 6 volume tiers from under 10 GB to over 200 GB, with cell tooltips for instant inspection.
- Lightweight Local Storage: Saves usage logs into
internet_usage.jsonlusing JSON Lines format for zero-overhead local persistence. - Deep Windows SRUM History Backfill: Queries the Windows System Resource Usage Monitor (SRUM) database directly via an Extensible Storage Engine (ESE) reader, backfilling historical bandwidth all the way back to your original Windows installation date.
- Plaintext
.datFile Import: Imports historical bandwidth logs exported from legacy monitors or custom tools in plaintext.datformat (YYYY/MM/DD UpKB/DownKB). - Bandwidth Quota Alerts: Configurable daily (5 GB – 500 GB) and monthly (100 GB – 5,000 GB) internet quota thresholds with desktop toast notifications and overlay flashing.
Network Configuration (Settings → Network)
Real-time throughput display options and the master traffic logging engine are configured in the settings window under Network:
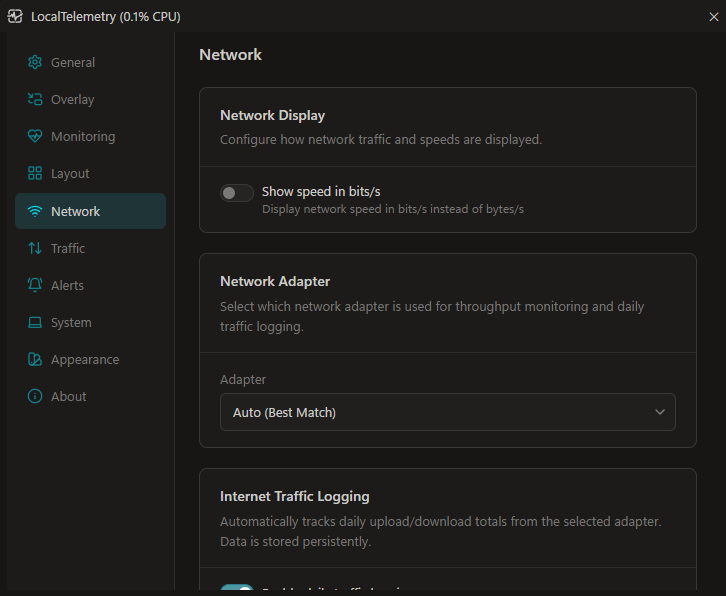 Network settings tab for selecting the preferred network adapter and enabling daily traffic logging.
Configuration Options
- Show Speed in Bits/s: Toggle between bytes per second (
B/s,KB/s,MB/s,GB/s) and bits per second (b/s,Kb/s,Mb/s,Gb/s) to match internet speed test conventions. - Network Adapter: Choose which network interface LocalTelemetry monitors:
Auto (Best Match)(default): Dynamically tracks the active default gateway / internet adapter.- Specific Adapter: Pins monitoring to a specific physical connection (e.g.
Ethernet,Wi-Fi).
- Enable Daily Traffic Logging: Master toggle for bandwidth logging (
$settings.netUsage.enabled). When enabled, LocalTelemetry accumulates daily byte deltas and writes them tointernet_usage.jsonl. When disabled, live overlay speed monitoring continues, but daily history is not recorded.
Traffic History Calendar (Settings → Traffic)
Historical bandwidth analytics, monthly navigation, and import tools are located under Traffic:
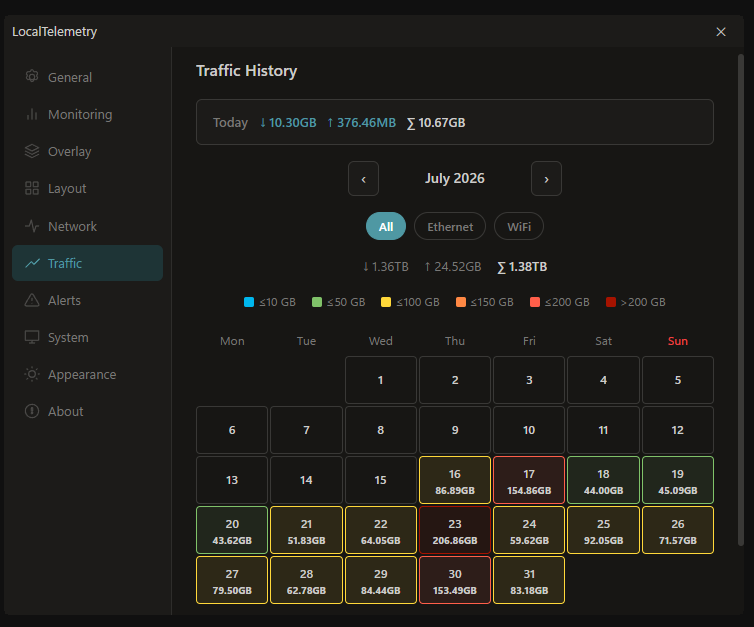 Traffic history calendar tab for viewing daily network download and upload bandwidth.
Today's Live Bandwidth Card
Displays live accumulated data transfer for the current calendar day:
- Incoming (
↓): Today's download volume (e.g.↓ 1.45GB). - Outgoing (
↑): Today's upload volume (e.g.↑ 230.12MB). - Combined (
∑): Total data transfer for today (e.g.∑ 1.68GB).
All bandwidth values are formatted using decimal SI units (B, KB, MB, GB, TB where 1 GB = 1,000,000,000 bytes).
Monthly Calendar View & Navigation
Month Navigation: Browse past and future months using the navigation buttons (
‹/›) surrounding the centered month label (e.g.September 2026).Month Totals Bar: Displays aggregated sums for the selected month:
↓ [Total Download]↑ [Total Upload]∑ [Total Combined](displayed in bold)
Monday–Sunday Grid: Calendar days are organized in a 7-column layout starting on Monday, with Sundays highlighted in red (
#ef4444). Empty cells align the first day of the month to its correct weekday.Cell Totals: Each date cell shows the day number and its total transferred bandwidth. Days with zero traffic display only the date number on a neutral uncolored background.
Hover Tooltips: Hovering over any date cell reveals a tooltip formatted with the localized date, download volume, upload volume, and combined sum:
textDD-MM-YYYY ↓ 2.10GB ↑ 450.00MB ∑ 2.55GB
Usage Tier Color Legend
Calendar cells are color-coded based on daily bandwidth consumption:
≤10 GB: Tier 1 (Cyan / Electric Blue#00b7ee)≤50 GB: Tier 2 (Light Green#80c269)≤100 GB: Tier 3 (Warm Yellow#ffd83a)≤150 GB: Tier 4 (Tangerine Orange#ff8844)≤200 GB: Tier 5 (Coral Red#ff5f4a)>200 GB: Tier 6 (Dark Red / Crimson#a61300)0 B: Uncolored neutral surface (tier-none)
Interface Breakdown Filters
Directly above the month totals, a dynamic filter bar generates pill buttons for the selected month:
- All: Displays combined bandwidth across all network adapters.
- Per-Adapter Pills: LocalTelemetry scans the month's records and automatically creates a dedicated filter button for every adapter discovered in that month's logs (such as
Ethernet,Wi-Fi, virtual adapters, orDat File). Clicking an adapter filters the calendar grid and recalculates monthly totals specifically for that interface.
Daily Detail Drill-Down
Clicking on any date cell opens an in-depth breakdown card displaying:
- Formatted Date:
DD-MM-YYYY. - Download: Exact incoming data volume (highlighted in primary theme color).
- Upload: Exact outgoing data volume (highlighted in accent color).
- Combined: Total transfer for that day.
- Per-Interface Breakdown: Itemized list showing each adapter that transferred data, with its download and upload totals:
- Source Provenance Badges:
Windows(blue badge): Record backfilled from the Windows SRUM database..DAT Import(orange badge): Record imported from an external.dattext file.- Unbadged: Live session data recorded directly by LocalTelemetry.
- Source Provenance Badges:
Clicking the selected day cell a second time closes the drill-down card.
Automatic Windows History Backfill & Manual Text Import
Automatic Startup Backfill (SRUM)
On launch, LocalTelemetry automatically inspects Windows system usage history so your calendar is populated with past data even before LocalTelemetry was installed:
- ESE Jet Blue Database Engine: LocalTelemetry directly accesses the Windows System Resource Usage Monitor database (
C:\Windows\System32\sru\SRUDB.dat) using an Extensible Storage Engine (ESE) reader. This bypasses the typical ~30-day historical limit of the Windows WinRT API. - Backfill to OS Installation Date: The engine queries the Windows registry (
HKLM\SOFTWARE\Microsoft\Windows NT\CurrentVersion\InstallTimeorInstallDate) to determine when Windows was originally installed, backfilling all daily usage up to yesterday without gaps. - WinRT Fallback: If the ESE database cannot be opened (e.g. due to system locking or permission constraints), LocalTelemetry automatically falls back to querying the WinRT
Windows.Networking.ConnectivityAPI. - Gap Detection: On subsequent launches, LocalTelemetry only imports missing days between the newest saved record and yesterday.
- Partial-Day Baseline Reconciling: Today's partial-day usage is seeded from Windows on startup. If live data is recorded while the background import runs, the live deltas are added onto the baseline so no traffic is lost or double-counted.
On-Demand Windows Network Usage Import
Under the Windows Network Usage section on the Traffic page, you can manually trigger backfill for any date range:
- Quick Presets: Select Last 7 Days, Last 14 Days, or Last 30 Days to automatically configure date boundaries.
- Custom Date Pickers: Specify custom From and To dates. The interface enforces real-time validation to prevent invalid, inverted, or future dates.
- Import Execution: Click Import from Windows. LocalTelemetry reads historical records from the Windows database for the requested range.
- Status Reporting: Displays the total days and bandwidth imported (e.g.
Imported 14 day(s): ↓ 12.45 GB, ↑ 2.10 GB) or confirms that the period is already up to date.
Manual Plaintext Backup File Import
Under the Import section on the Traffic page, click Select .dat file to load external bandwidth logs:
Supported Format: Plaintext
.datfiles with a header line and daily records formatted asYYYY/MM/DD UpKB/DownloadKB:textDate Upload/Download KB 2026/08/01 1024/2048 2026/08/02 51200/102400Processing: Lines are validated, values are converted to bytes, assigned the interface
Dat Filewith sourceDatImport, and saved intointernet_usage.jsonl.Status Feedback: Displays the number of days imported (e.g.
Imported 31 day(s)) or an error message if parsing fails.
Binary SRUDB.dat Files
The Select .dat file button is designed specifically for plaintext text logs (such as exports from NetSpeedMonitor or custom scripts). Do not manually select the Windows binary SRUDB.dat file with this button; LocalTelemetry already reads Windows SRUDB.dat automatically in the background using its built-in ESE reader.
Bandwidth Quotas & Threshold Alerts (Settings → Alerts)
LocalTelemetry can notify you when your internet consumption approaches or exceeds bandwidth limits:
- Daily Internet Usage (
AlertNetDaily): Configurable threshold from5 GBto500 GB(evaluated against today's accumulated total). - Monthly Internet Usage (
AlertNetMonthly): Configurable threshold from100 GBto5,000 GB(evaluated against the current month's total). - Notification Methods:
- Show Tray Notification: Out-of-process toast popups in the lower-right corner of your screen.
- Flash Overlay Briefly: Translucent orange flash (
#FF5000) across the taskbar overlay.
100% Private Local Storage Architecture
All network logs are stored 100% locally on your machine:
- Installer Mode:
%LOCALAPPDATA%\LocalTelemetry\internet_usage.jsonl. - Portable Mode: Saved directly in the application folder alongside
LocalTelemetry.exe.
Local Data Storage Format
The log file uses JSON Lines (internet_usage.jsonl), where each line is a self-contained JSON object:
{"date":"18-09-2026","download_bytes":2147483648,"upload_bytes":524288000,"total_bytes":2671771648,"interface":"Ethernet","source":"LocalTelemetry"}- Descending Sort: Records are ordered newest-first for rapid loading.
- Deduplication: Records are keyed on
(Year, Month, Day, Interface). Named-interface records automatically supersede generic unnamed records for the same date. - Midnight Rollover: The background logger detects midnight date transitions, writes the previous day's final totals, clears memory counters, and begins tracking the new day.
- Shutdown Flush: Pending memory counters are flushed to disk when LocalTelemetry exits.
Privacy Guarantee
LocalTelemetry never tracks website URLs, visited IP addresses, DNS queries, or packet contents. Only raw numerical byte counts, network adapter names, date timestamps, and data sources are recorded. No data is ever transmitted off your device.